Grundlæggende statistik
| Institutionelle ejere | 210 total, 201 long only, 0 short only, 9 long/short - change of -2,81% MRQ |
| Gennemsnitlig porteføljeallokering | 1.1741 % - change of 0,72% MRQ |
| Institutionelle aktier (lange) | 261.869.116 (ex 13D/G) - change of 2,19MM shares 0,59% MRQ |
| Institutionel værdi (lang) | $ 2.801.694 USD ($1000) |
Institutionelt ejerskab og aktionærer
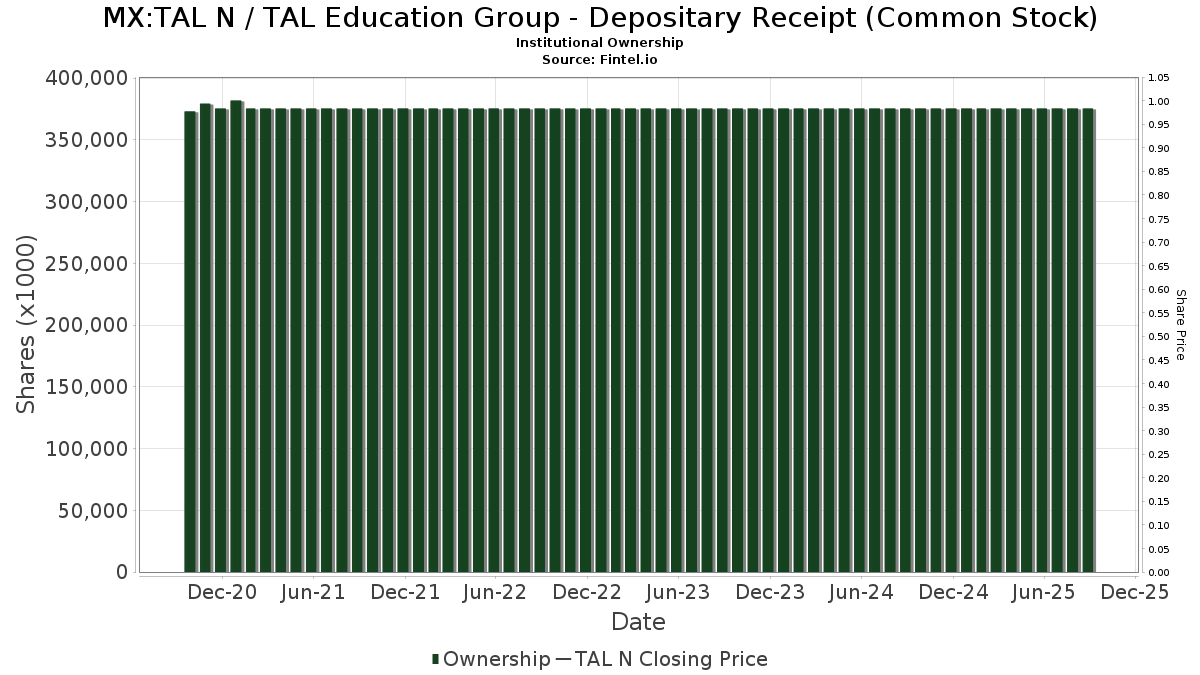
TAL Education Group - Depositary Receipt (Common Stock) (MX:TAL N) har 210 institutionelle ejere og aktionærer, der har indsendt 13D/G- eller 13F-formularer til Securities Exchange Commission (SEC). Disse institutioner har i alt 261,869,116 aktier. Største aktionærer omfatter BlackRock, Inc., Fmr Llc, Krane Funds Advisors LLC, Ubs Asset Management Americas Inc, Vanguard Group Inc, Morgan Stanley, CoreView Capital Management Ltd, Bank Of America Corp /de/, Robeco Institutional Asset Management B.V., and Tiger Pacific Capital LP .
TAL Education Group - Depositary Receipt (Common Stock) (BMV:TAL N) institutionel ejerskabsstruktur viser aktuelle positioner i virksomheden efter institutioner og fonde, samt seneste ændringer i positionsstørrelse. Større aktionærer kan omfatte individuelle investorer, investeringsforeninger, hedgefonde eller institutioner. Skema 13D angiver, at investoren besidder (eller besidder) mere end 5 % af virksomheden og har til hensigt (eller har til hensigt at) aktivt at forfølge en ændring i forretningsstrategi. Skema 13G indikerer en passiv investering på over 5%.
Fondens stemningsscore
Fund Sentiment Score (fka Ownership Accumulation Score) finder de aktier, der bliver mest købt af fonde. Det er resultatet af en sofistikeret, multi-faktor kvantitativ model, der identificerer virksomheder med de højeste niveauer af institutionel akkumulering. Scoringsmodellen bruger en kombination af den samlede stigning i oplyste ejere, ændringerne i porteføljeallokeringer i disse ejere og andre målinger. Tallet går fra 0 til 100, hvor højere tal indikerer et højere niveau af akkumulering for sine jævnaldrende, og 50 er gennemsnittet.
Opdateringsfrekvens: Dagligt
Se Ownership Explorer, som giver en liste over højest rangerende virksomheder.
AI+ Ask Fintel’s AI assistant about TAL Education Group - Depositary Receipt (Common Stock).
Select a question to share a public post with an AI-crafted answer.
Thinking of good questions…
13F og NPORT arkivering
Detaljer om 13F-arkivering er gratis. Detaljer om NP-ansøgninger kræver et premium-medlemskab. Grønne rækker angiver nye positioner. Røde rækker angiver lukkede positioner. Klik på linket ikon for at se den fulde transaktionshistorik.
Opgrader
for at låse premium-data op og eksportere til Excel ![]() .
.
| Fil dato | Kilde | Investor | Type | Gennemsnitlig pris (Øst) |
Aktier | Δ Aktier (%) |
Rapporteret Værdi ($1000) |
Δ Værdi (%) |
Port Alloc (%) |
|
|---|---|---|---|---|---|---|---|---|---|---|
| 2026-04-23 | 13F | iA Global Asset Management Inc. | 492 | 0 | ||||||
| 2026-01-16 | 13F | Standard Life Aberdeen plc | 351.248 | 0,03 | 3.832 | -3,16 | ||||
| 2026-02-13 | 13F | Vontobel Holding Ltd. | 36.488 | 240,60 | 398 | 234,45 | ||||
| 2026-04-17 | 13F | Murphy & Mullick Capital Management Corp | 0 | -100,00 | 0 | |||||
| 2025-11-12 | 13F | Steward Partners Investment Advisory, Llc | 0 | -100,00 | 0 | -100,00 | ||||
| 2026-01-20 | 13F | Myriad Asset Management US LP | 0 | -100,00 | 0 | |||||
| 2026-02-13 | 13F | Natixis | 9.932 | -52,98 | 108 | -54,24 | ||||
| 2026-02-05 | 13F | DnB Asset Management AS | 35.263 | 0,00 | 385 | -2,54 | ||||
| 2026-02-13 | 13F | Sei Investments Co | 168.858 | 235,70 | 1.842 | 227,18 | ||||
| 2025-11-07 | 13F | Shell Asset Management Co | 16.432 | 4,68 | 0 | |||||
| 2026-02-17 | 13F | Susquehanna Portfolio Strategies, LLC | 728.919 | -18,01 | 7.953 | -20,14 | ||||
| 2025-11-12 | 13F | Maseco Llp | 0 | -100,00 | 0 | -100,00 | ||||
| 2025-11-14 | 13F | Beacon Pointe Advisors, LLC | 0 | -100,00 | 0 | |||||
| 2026-02-10 | 13F | Gulf International Bank (UK) Ltd | 28.991 | 0,00 | 0 | |||||
| 2026-02-12 | 13F | Federation des caisses Desjardins du Quebec | 21.747 | 21,98 | 237 | 19,10 | ||||
| 2026-02-17 | 13F | Laird Norton Trust Company, Llc | 52.604 | 574 | ||||||
| 2026-02-17 | 13F | Nearwater Capital Markets, Ltd | 700.000 | 0,00 | 7.637 | -2,59 | ||||
| 2026-02-11 | 13F | Krane Funds Advisors LLC | 21.231.472 | -7,98 | 231.635 | -8,61 | ||||
| 2026-02-12 | 13F | Campbell & CO Investment Adviser LLC | 0 | -100,00 | 0 | |||||
| 2026-02-17 | 13F | Citadel Advisors Llc | Put | 45.300 | -43,09 | 494 | -44,56 | |||
| 2026-02-17 | 13F | Citadel Advisors Llc | Call | 89.000 | 28,06 | 971 | 24,68 | |||
| 2026-04-24 | 13F | IFM Investors Pty Ltd | 45.508 | 0,00 | 517 | |||||
| 2026-02-06 | 13F | Leonteq Securities AG | 43.657 | 385,13 | 476 | 376,00 | ||||
| 2026-04-21 | 13F | Robeco Institutional Asset Management B.V. | 10.750.078 | 1.210,16 | 122.228 | 1.265,52 | ||||
| 2026-02-10 | 13F | National Pension Service | 116.953 | 8,31 | 1.276 | 5,46 | ||||
| 2026-02-13 | 13F | Manufacturers Life Insurance Company, The | 0 | -100,00 | 0 | |||||
| 2026-02-17 | 13F | Citadel Advisors Llc | 234.657 | -45,46 | 2.560 | -46,87 | ||||
| 2026-02-13 | 13F | Arrowstreet Capital, Limited Partnership | 5.848.885 | 27,87 | 63.811 | 24,56 | ||||
| 2026-02-13 | 13F | Oasis Management Co Ltd. | 686.805 | 0,00 | 7.493 | -2,59 | ||||
| 2025-11-14 | 13F | Aspex Management (HK) Ltd | 0 | -100,00 | 0 | -100,00 | ||||
| 2026-02-17 | 13F | Tower Research Capital LLC (TRC) | 133 | 19,82 | 1 | 0,00 | ||||
| 2026-04-08 | 13F | E Fund Management (Hong Kong) Co., Ltd. | 162.585 | -3,00 | 1.849 | -9,01 | ||||
| 2026-02-17 | 13F | Nomura Holdings Inc | 58.568 | 0,00 | 639 | -2,60 | ||||
| 2025-11-14 | 13F | Aqr Capital Management Llc | 0 | -100,00 | 0 | |||||
| 2026-02-12 | 13F | Swiss National Bank | 910.519 | -2,86 | 9.934 | -5,37 | ||||
| 2026-02-13 | 13F | Prudential Financial Inc | 292.100 | 3.187 | ||||||
| 2026-02-10 | 13F | CIBC Asset Management Inc | 11.042 | 120 | ||||||
| 2025-11-14 | 13F | Caption Management, LLC | Call | 0 | -100,00 | 0 | ||||
| 2026-02-17 | 13F | Balyasny Asset Management Llc | 0 | -100,00 | 0 | -100,00 | ||||
| 2026-04-23 | 13F | Lansforsakringar Fondforvaltning AB (publ) | 82.000 | 0,00 | 932 | 4,25 | ||||
| 2026-01-26 | 13F | Mirae Asset Global Investments Co., Ltd. | 131.782 | -8,49 | 1.438 | -10,86 | ||||
| 2026-02-09 | 13F | Accent Capital Management, LLC | 640 | 0,00 | 7 | -14,29 | ||||
| 2026-02-17 | 13F | Credit Agricole S A | 16.329 | 0,00 | 178 | -2,20 | ||||
| 2026-02-04 | 13F | Swiss Life Asset Management Ltd | 49.055 | 14,37 | 535 | 11,46 | ||||
| 2026-02-09 | 13F | Catalyst Funds Management Pty Ltd | 27.700 | 302 | ||||||
| 2025-11-14 | 13F | Scientech Research LLC | 0 | -100,00 | 0 | -100,00 | ||||
| 2026-02-13 | 13F | Royal London Asset Management Ltd | 414.974 | -3,35 | 4.527 | -5,84 | ||||
| 2026-02-10 | 13F | Nomura Asset Management Co Ltd | 51.900 | 0,00 | 566 | -2,58 | ||||
| 2026-02-13 | 13F | Charles Schwab Investment Management Inc | 497.194 | 0,15 | 5.424 | -2,45 | ||||
| 2026-02-10 | 13F | Daiwa Securities Group Inc. | 5.750 | 194,87 | 0 | |||||
| 2026-02-10 | 13F | Quantbot Technologies LP | 0 | -100,00 | 0 | |||||
| 2026-04-06 | 13F | Highline Wealth Partners Llc | 0 | -100,00 | 0 | |||||
| 2026-02-17 | 13F | Prelude Capital Management, Llc | 0 | -100,00 | 0 | |||||
| 2026-02-06 | 13F | Global Retirement Partners, LLC | 156 | 0,00 | 2 | 0,00 | ||||
| 2026-02-17 | 13F | Quadrature Capital Ltd | 0 | -100,00 | 0 | |||||
| 2026-01-29 | 13F | Vanguard Group Inc | 17.671.668 | 1,60 | 192.798 | -1,04 | ||||
| 2026-02-18 | 13F | Vident Advisory, LLC | 20.962 | 1,98 | 229 | -0,87 | ||||
| 2025-11-14 | 13F | Point72 Hong Kong Ltd | 0 | -100,00 | 0 | -100,00 | ||||
| 2026-01-28 | 13F | B. Metzler seel. Sohn & Co. AG | 24.765 | 270 | ||||||
| 2026-02-11 | 13F | Franklin Resources Inc | 307.405 | 5,98 | 3.354 | 3,23 | ||||
| 2025-11-14 | 13F | Mount Yale Investment Advisors, LLC | 0 | -100,00 | 0 | |||||
| 2025-11-14 | 13F | Parallax Volatility Advisers, L.P. | Call | 0 | -100,00 | 0 | ||||
| 2026-02-13 | 13F | Marshall Wace, Llp | 0 | -100,00 | 0 | |||||
| 2026-02-17 | 13F | XTX Topco Ltd | 103.749 | 27,69 | 1.132 | 24,42 | ||||
| 2026-02-13 | 13F | Barclays Plc | 1.094.352 | 153,12 | 11.939 | 146,57 | ||||
| 2026-02-12 | 13F | Hrt Financial Lp | 24.500 | 0 | ||||||
| 2026-02-13 | 13F | Y-Intercept (Hong Kong) Ltd | 0 | -100,00 | 0 | |||||
| 2025-11-14 | 13F | Balyasny Asset Management Llc | Call | 0 | -100,00 | 0 | -100,00 | |||
| 2025-11-14 | 13F | Verition Fund Management LLC | 0 | -100,00 | 0 | |||||
| 2026-04-20 | 13F | Ronald Blue Trust, Inc. | 228 | -67,52 | 3 | -71,43 | ||||
| 2026-02-09 | 13F | Beck Bode, LLC | 522.197 | -1,90 | 5.697 | -4,43 | ||||
| 2025-11-13 | 13F | Clear Street Markets Llc | 0 | -100,00 | 0 | -100,00 | ||||
| 2025-11-14 | 13F | Balyasny Asset Management Llc | Put | 0 | -100,00 | 0 | -100,00 | |||
| 2026-02-17 | 13F | Wellington Management Group Llp | 434.341 | 152,95 | 4.739 | 146,39 | ||||
| 2026-02-17 | 13F | Russell Investments Group, Ltd. | 154.235 | 998,70 | 1.695 | 979,62 | ||||
| 2026-04-17 | 13F | AdvisorNet Financial, Inc | 0 | -100,00 | 0 | |||||
| 2026-01-15 | 13F | Nisa Investment Advisors, Llc | 200 | 0,00 | 2 | 0,00 | ||||
| 2026-02-11 | 13F | O'shaughnessy Asset Management, Llc | 17.878 | 1,14 | 195 | -1,02 | ||||
| 2026-02-13 | 13F | Van Eck Associates Corp | 215.198 | -10,99 | 2 | 0,00 | ||||
| 2026-02-13 | 13F | Gts Securities Llc | 0 | -100,00 | 0 | |||||
| 2026-02-06 | 13F | Pnc Financial Services Group, Inc. | 16.693 | 9,93 | 182 | 7,06 | ||||
| 2025-11-14 | 13F | AXA Investment Managers S.A. | 28.381 | 318 | ||||||
| 2026-02-13 | 13F | Korea Investment CORP | 290.411 | 56,55 | 3.168 | 52,53 | ||||
| 2026-03-02 | 13F | Tobam | 0 | -100,00 | 0 | |||||
| 2026-02-13 | 13F | OMERS ADMINISTRATION Corp | 0 | -100,00 | 0 | |||||
| 2026-02-13 | 13F | Public Sector Pension Investment Board | 0 | -100,00 | 0 | |||||
| 2026-02-17 | 13F | Millennium Management Llc | 960.977 | 763,68 | 10.484 | 741,41 | ||||
| 2026-02-17 | 13F | CoreView Capital Management Ltd | 10.997.165 | 0,00 | 119.979 | -2,59 | ||||
| 2026-01-23 | 13F | Assetmark, Inc | 56 | 107,41 | 1 | |||||
| 2025-11-14 | 13F | Squarepoint Ops LLC | Put | 0 | -100,00 | 0 | -100,00 | |||
| 2026-04-15 | 13F | Gf Fund Management Co. Ltd. | 402.304 | 5,78 | 4.574 | 10,24 | ||||
| 2026-02-17 | 13F | Edmond De Rothschild Holding S.a. | 111.940 | 0,00 | 1.221 | -2,55 | ||||
| 2025-11-14 | 13F | DRW Securities, LLC | 0 | -100,00 | 0 | |||||
| 2026-02-17 | 13F | Fmr Llc | 21.490.725 | -12,28 | 234.464 | -14,56 | ||||
| 2026-02-10 | 13F | Connor, Clark & Lunn Investment Management Ltd. | 1.851.871 | 34,93 | 20.204 | 31,44 | ||||
| 2026-02-17 | 13F | Amundi | 1.049.925 | -2,74 | 11.455 | -5,60 | ||||
| 2026-02-13 | 13F | Discerene Group LP | 1.354.733 | 0,00 | 14.780 | -2,59 | ||||
| 2025-11-05 | 13F | SOUTH STATE Corp | 0 | -100,00 | 0 | |||||
| 2026-02-13 | 13F | Morgan Stanley | 13.637.220 | -4,60 | 148.782 | -7,07 | ||||
| 2025-11-13 | 13F | Farringdon Capital, Ltd. | 0 | -100,00 | 0 | |||||
| 2026-02-17 | 13F | Shay Capital LLC | 510.000 | 0,00 | 5.564 | -2,59 | ||||
| 2026-02-09 | 13F | Geode Capital Management, Llc | 2.670.368 | 1,85 | 28.865 | -0,74 | ||||
| 2026-02-06 | 13F | Gsa Capital Partners Llp | 52.123 | -34,05 | 1 | |||||
| 2026-02-17 | 13F | Bank Of America Corp /de/ | 10.755.536 | -22,55 | 117.343 | -24,55 | ||||
| 2026-02-09 | 13F/A | Swedbank AB | 140.041 | 75,18 | 1.528 | 70,61 | ||||
| 2026-02-17 | 13F | Two Sigma Securities, Llc | 0 | -100,00 | 0 | |||||
| 2025-11-07 | 13F | Sierra Ocean, Llc | 0 | -100,00 | 0 | |||||
| 2026-02-17 | 13F | Tiger Pacific Capital LP | 7.977.772 | -4,87 | 87.037 | -7,34 | ||||
| 2026-02-13 | 13F | Oakum Bay Capital LLC | 23.000 | 251 | ||||||
| 2026-02-13 | 13F | Ieq Capital, Llc | 14.977 | 36,20 | 163 | 32,52 | ||||
| 2026-04-21 | 13F | PharVision Advisers, LLC | 0 | -100,00 | 0 | |||||
| 2026-02-10 | 13F | Bank of New York Mellon Corp | 614.878 | 38,72 | 6.708 | 35,13 | ||||
| 2026-02-12 | 13F | CIBC Private Wealth Group, LLC | 330 | 0,00 | 4 | 0,00 | ||||
| 2026-02-12 | 13F | Aviva Plc | 300.216 | -3,04 | 3.275 | -5,54 | ||||
| 2026-02-13 | 13F | JustInvest LLC | 21.384 | 17,33 | 233 | 14,22 | ||||
| 2026-04-02 | 13F | Marex Group plc | 0 | 0 | ||||||
| 2026-01-23 | 13F | Sumitomo Mitsui Trust Holdings, Inc. | 923.469 | -4,35 | 10.075 | -6,83 | ||||
| 2026-02-10 | 13F | Fideuram Asset Management (Ireland) dac | 246.509 | 2.652 | ||||||
| 2026-02-17 | 13F | Jain Global LLC | 0 | -100,00 | 0 | |||||
| 2026-02-17 | 13F | Optiver Holding B.V. | 245 | 3 | ||||||
| 2026-02-13 | 13F | Sequoia China Equity Partners (Hong Kong) Ltd | 0 | -100,00 | 0 | |||||
| 2026-02-17 | 13F | Trexquant Investment LP | 0 | -100,00 | 0 | |||||
| 2026-02-11 | 13F | Prudential Plc | 95.527 | -44,41 | 1.042 | -45,84 | ||||
| 2026-02-17 | 13F | Advisory Services Network, LLC | 0 | -100,00 | 0 | |||||
| 2026-02-12 | 13F | Ensign Peak Advisors, Inc | 21.750 | 0,00 | 237 | -2,47 | ||||
| 2026-02-17 | 13F | Lazard Asset Management Llc | 307.150 | 3.351 | ||||||
| 2025-11-14 | 13F | Peak6 Llc | 0 | -100,00 | 0 | -100,00 | ||||
| 2026-02-13 | 13F | Macquarie Group Ltd | 31.567 | -99,48 | 344 | -99,49 | ||||
| 2026-04-22 | 13F | Stone House Investment Management, LLC | 31 | 0 | ||||||
| 2026-02-02 | 13F | Danske Bank A/s | 120.947 | 0,00 | 1.320 | -2,58 | ||||
| 2026-02-10 | 13F | Goldman Sachs Group Inc | 5.830.789 | -9,36 | 63.614 | -11,71 | ||||
| 2026-02-17 | 13F | HighVista Strategies LLC | 0 | -100,00 | 0 | |||||
| 2026-04-10 | 13F | Abound Wealth Management | 0 | -100,00 | 0 | |||||
| 2026-02-11 | 13F | Deutsche Bank Ag\ | 928.007 | 7,83 | 10.125 | 5,04 | ||||
| 2026-02-12 | 13F | Renaissance Technologies Llc | 0 | -100,00 | 0 | -100,00 | ||||
| 2026-02-12 | 13F | Voya Investment Management Llc | 21.687 | -3,20 | 237 | -5,60 | ||||
| 2026-02-10 | 13F | Envestnet Asset Management Inc | 15.323 | -13,01 | 167 | -15,23 | ||||
| 2026-02-11 | 13F | West Family Investments, Inc. | 26.192 | 0,00 | 286 | -2,73 | ||||
| 2026-02-17 | 13F | Delaware Management Holdings, Inc. | 4.733.473 | 51.642 | ||||||
| 2026-02-11 | 13F | Cerity Partners LLC | 15.078 | 0,43 | 165 | -2,38 | ||||
| 2026-04-16 | 13F | SG Americas Securities, LLC | 354.271 | 50,26 | 4 | 100,00 | ||||
| 2026-02-10 | 13F | Eurizon Capital SGR S.p.A. | 73.979 | 807 | ||||||
| 2026-02-11 | 13F | Simplex Trading, Llc | Put | 78.000 | -5,68 | 851 | ||||
| 2026-02-13 | 13F | State Street Corp | 7.818.834 | 3,51 | 85.303 | 0,83 | ||||
| 2026-02-11 | 13F | Simplex Trading, Llc | 93.939 | 27,62 | 1.025 | |||||
| 2026-02-11 | 13F | Simplex Trading, Llc | Call | 23.600 | 6,79 | 257 | ||||
| 2025-11-14 | 13F | Wetherby Asset Management Inc | 44.013 | 0,00 | 493 | 9,58 | ||||
| 2026-04-24 | 13F | Yousif Capital Management, Llc | 15.097 | 0,00 | 172 | 6,21 | ||||
| 2026-04-13 | 13F | True Wealth Design, LLC | 115 | 69,12 | 1 | |||||
| 2026-02-12 | 13F | Quadrant Capital Group Llc | 28.205 | 0,00 | 308 | -2,54 | ||||
| 2026-02-12 | 13F | Skopos Labs, Inc. | 43.072 | 288,74 | 473 | 281,45 | ||||
| 2026-02-17 | 13F | Price T Rowe Associates Inc /md/ | 14.900 | -29,25 | 0 | |||||
| 2026-02-11 | 13F | Parallel Advisors, LLC | 14.771 | 0,00 | 161 | -2,42 | ||||
| 2025-11-14 | 13F | Centiva Capital, LP | 0 | -100,00 | 0 | |||||
| 2026-02-17 | 13F | Dv Equities, Llc | 4.461 | 49 | ||||||
| 2026-04-07 | 13F | Signaturefd, Llc | 22.336 | 0,00 | 254 | 4,12 | ||||
| 2026-02-06 | 13F | Resona Asset Management Co.,Ltd. | 103.176 | -11,25 | 1.127 | -13,58 | ||||
| 2026-02-06 | 13F | Greenwoods Asset Management Hong Kong Ltd. | 2.597.180 | 0,00 | 28.335 | -2,59 | ||||
| 2026-02-13 | 13F | MAI Capital Management | 290 | 0,00 | 3 | 0,00 | ||||
| 2025-11-14 | 13F | Arrowpoint Investment Partners (Singapore) Pte. Ltd. | 0 | -100,00 | 0 | -100,00 | ||||
| 2026-02-13 | 13F | BRITISH COLUMBIA INVESTMENT MANAGEMENT Corp | 161.000 | 0,00 | 1.757 | -2,61 | ||||
| 2026-02-18 | 13F | Mackenzie Financial Corp | 439.824 | -43,19 | 4.829 | -44,32 | ||||
| 2026-04-15 | 13F | Bayforest Capital Ltd | 6.262 | -76,26 | 71 | -75,26 | ||||
| 2026-02-03 | 13F | Ballentine Partners, LLC | 10.271 | 112 | ||||||
| 2026-02-17 | 13F | Two Sigma Advisers, Lp | 931.300 | -13,48 | 10.160 | -15,72 | ||||
| 2026-02-11 | 13F | Group One Trading, L.p. | 0 | -100,00 | 0 | -100,00 | ||||
| 2026-04-22 | 13F | Pictet Asset Management Holding SA | 467.900 | -12,85 | 5.320 | -9,17 | ||||
| 2026-02-17 | 13F | Susquehanna International Group, Llp | Call | 345.500 | 2,01 | 3.769 | -0,63 | |||
| 2026-02-13 | 13F | Pinpoint Asset Management (Singapore) Pte. Ltd. | 74.346 | 110,36 | 811 | 105,32 | ||||
| 2026-02-17 | 13F | Susquehanna International Group, Llp | 176.766 | 620,99 | 1.929 | 603,65 | ||||
| 2026-01-30 | 13F | FengHe Fund Management Pte. Ltd. | 799.195 | -9,35 | 8.719 | -11,70 | ||||
| 2026-02-17 | 13F | Susquehanna International Group, Llp | Put | 148.700 | -8,72 | 1.622 | -11,07 | |||
| 2026-02-18 | 13F | GWM Advisors LLC | 53.447 | 583 | ||||||
| 2026-02-10 | 13F | State of Wyoming | 19.450 | 212 | ||||||
| 2026-02-13 | 13F | Quarry LP | 848 | -77,59 | 9 | -78,57 | ||||
| 2026-02-05 | 13F | May Hill Capital, LLC | 16.744 | 183 | ||||||
| 2026-04-06 | 13F | Versant Capital Management, Inc | 45 | 1 | ||||||
| 2026-02-17 | 13F | Rakuten Investment Management, Inc. | 15.620 | 2.131,43 | 172 | 800,00 | ||||
| 2025-11-14 | 13F | Polymer Capital Management (HK) LTD | 0 | -100,00 | 0 | |||||
| 2026-02-13 | 13F | Great West Life Assurance Co /can/ | 447.980 | -41,66 | 5 | -50,00 | ||||
| 2026-02-17 | 13F | Caisse De Depot Et Placement Du Quebec | 172.669 | 16,59 | 1.884 | 13,57 | ||||
| 2026-02-10 | 13F | Acadian Asset Management Llc | 3.231.662 | 80,39 | 35 | 75,00 | ||||
| 2026-03-03 | 13F/A | Caitong International Asset Management Co., Ltd | 116 | -40,51 | 1 | -50,00 | ||||
| 2026-04-16 | 13F | TB Alternative Assets Ltd. | 0 | -100,00 | 0 | |||||
| 2026-02-11 | 13F | Jpmorgan Chase & Co | 1.490.068 | -43,41 | 16.257 | -44,88 | ||||
| 2026-02-13 | 13F | Smartleaf Asset Management LLC | 286 | 4,76 | 3 | 0,00 | ||||
| 2025-11-14 | 13F | Peak6 Llc | Call | 0 | -100,00 | 0 | -100,00 | |||
| 2026-02-17 | 13F | California State Teachers Retirement System | 301.543 | 4,29 | 3.290 | 1,58 | ||||
| 2026-02-10 | 13F | Bnp Paribas Arbitrage, Sa | 2.385.914 | -0,88 | 26.030 | -3,45 | ||||
| 2026-02-17 | 13F | Capitolis Liquid Global Markets LLC | 4.779.700 | -32,31 | 52.147 | -34,07 | ||||
| 2026-02-17 | 13F | Ameriprise Financial Inc | 85.768 | 158,28 | 936 | 152,02 | ||||
| 2025-11-13 | 13F | LGT Group Foundation | 0 | -100,00 | 0 | |||||
| 2026-02-12 | 13F | Jane Street Group, Llc | 333.146 | -62,50 | 3.635 | -63,47 | ||||
| 2025-11-14 | 13F | Axa S.a. | 0 | -100,00 | 0 | |||||
| 2026-02-12 | 13F | Jane Street Group, Llc | Put | 375.400 | -18,87 | 4.096 | -20,98 | |||
| 2026-02-12 | 13F | Jane Street Group, Llc | Call | 51.700 | 44,01 | 564 | 40,30 | |||
| 2026-02-13 | 13F | Citigroup Inc | 1.559.428 | 87,61 | 17.013 | 82,76 | ||||
| 2026-01-27 | 13F | Asset Management One Co., Ltd. | 64.362 | 0,00 | 707 | -1,81 | ||||
| 2026-02-17 | 13F | SageView Advisory Group, LLC | 276 | 3 | ||||||
| 2025-11-14 | 13F | Cubist Systematic Strategies, LLC | 0 | -100,00 | 0 | |||||
| 2026-01-29 | 13F | UBS Group AG | Call | 259.538 | 591,40 | 2.832 | 574,05 | |||
| 2026-01-29 | 13F | UBS Group AG | 1.277.007 | -19,47 | 13.932 | -21,55 | ||||
| 2026-02-13 | 13F | Squarepoint Ops LLC | Call | 30.700 | 0,00 | 335 | -2,62 | |||
| 2026-01-28 | 13F | DekaBank Deutsche Girozentrale | 18.592 | 0,00 | 2 | |||||
| 2026-02-13 | 13F | Squarepoint Ops LLC | 123.400 | 0,00 | 1.346 | -2,60 | ||||
| 2026-02-06 | 13F | Profund Advisors Llc | 22.222 | -19,76 | 242 | -21,94 | ||||
| 2026-02-11 | 13F | Group One Trading, L.p. | Put | 115.000 | -5,43 | 1.255 | -7,86 | |||
| 2026-02-12 | 13F | Skandinaviska Enskilda Banken AB (publ) | 652.021 | 2.643,85 | 7.114 | 2.574,06 | ||||
| 2026-02-11 | 13F | Group One Trading, L.p. | Call | 369.800 | 193,73 | 4.035 | 186,10 | |||
| 2026-02-10 | 13F | Norges Bank | 4.505.740 | 49.158 | ||||||
| 2026-01-26 | 13F | Cwm, Llc | 1.666 | -19,56 | 0 | |||||
| 2026-02-03 | 13F | Mitsubishi UFJ Kokusai Asset Management Co., Ltd. | 500.986 | 21,18 | 5.756 | 24,32 | ||||
| 2026-02-12 | 13F | BlackRock, Inc. | 27.305.227 | 11,60 | 297.900 | 8,71 | ||||
| 2026-02-17 | 13F | Long Focus Capital Management, Llc | 1.117.300 | 0,00 | 12.190 | -2,59 | ||||
| 2026-02-17 | 13F | Jones Financial Companies Lllp | 154 | 2 | ||||||
| 2025-11-13 | 13F | Quantitative Investment Management, LLC | 0 | -100,00 | 0 | |||||
| 2026-02-13 | 13F | Walleye Trading LLC | Put | 55.800 | -84,10 | 609 | -84,53 | |||
| 2026-02-17 | 13F | Monolith Management Ltd | 0 | -100,00 | 0 | |||||
| 2026-02-12 | 13F | California Public Employees Retirement System | 672.183 | 23,24 | 7.334 | 20,04 | ||||
| 2026-02-13 | 13F | Walleye Trading LLC | Call | 7.600 | 442,86 | 83 | 446,67 | |||
| 2025-11-14 | 13F | Wolverine Trading, Llc | Call | 28.900 | -3,67 | 326 | 1,56 | |||
| 2025-11-14 | 13F | Wolverine Trading, Llc | Put | 26.300 | -28,14 | 296 | -24,30 | |||
| 2026-02-13 | 13F | Walleye Trading LLC | 25.170 | -48,69 | 275 | -50,09 | ||||
| 2026-02-13 | 13F | Walleye Capital LLC | Call | 15.900 | 173 | |||||
| 2026-02-13 | 13F | Walleye Capital LLC | Put | 20.000 | 218 | |||||
| 2026-02-17 | 13F | Royal Bank Of Canada | 33.788 | -93,01 | 369 | -93,19 | ||||
| 2026-02-13 | 13F | Walleye Capital LLC | 12.672 | 138 | ||||||
| 2026-02-17 | 13F | Jump Financial, LLC | 83.017 | -40,83 | 906 | -42,39 | ||||
| 2026-02-13 | 13F | Pinnacle Wealth Planning Services, Inc. | 2.267 | 25 | ||||||
| 2026-02-17 | 13F | Northern Trust Corp | 1.873.143 | -2,80 | 20.436 | -5,32 | ||||
| 2026-02-17 | 13F | Quantinno Capital Management LP | 85.881 | 53,67 | 937 | 49,76 | ||||
| 2026-02-13 | 13F | Healthcare Of Ontario Pension Plan Trust Fund | 3.112.200 | -24,64 | 33.954 | -26,59 | ||||
| 2026-02-11 | 13F | OPTIMAS CAPITAL Ltd | 0 | -100,00 | 0 | |||||
| 2026-02-13 | 13F | American Century Companies Inc | 27.881 | 0,00 | 304 | -2,56 | ||||
| 2026-01-29 | 13F | China Universal Asset Management Co., Ltd. | 82.000 | 895 | ||||||
| 2026-03-06 | 13F | Hsbc Holdings Plc | Call | 0 | -100,00 | 0 | ||||
| 2026-04-16 | 13F | E. Ohman J:or Asset Management AB | 0 | -100,00 | 0 | |||||
| 2026-01-30 | 13F | Us Bancorp \de\ | 53.724 | 69,08 | 586 | 65,07 | ||||
| 2026-02-09 | 13F | Hantz Financial Services, Inc. | 26.234 | 171,40 | 0 | |||||
| 2026-02-03 | 13F | Ethic Inc. | 11.218 | 122 | ||||||
| 2026-02-13 | 13F | Pathstone Holdings, LLC | 15.564 | 3,00 | 170 | 0,00 | ||||
| 2026-02-12 | 13F | Wealthspire Advisors, LLC | 0 | -100,00 | 0 | |||||
| 2026-02-03 | 13F | Sequoia Financial Advisors, LLC | 13.407 | 2,11 | 146 | -0,68 | ||||
| 2026-01-28 | 13F | Klp Kapitalforvaltning As | 133.300 | 0,00 | 1.454 | -2,55 | ||||
| 2026-02-14 | 13F | Rockefeller Capital Management L.P. | 101 | 0,00 | 1 | 0,00 | ||||
| 2026-04-24 | 13F | Raiffeisen Bank International AG | 22.500 | -77,66 | 248 | -77,69 | ||||
| 2026-02-13 | 13F | Police & Firemen's Retirement System of New Jersey | 49.327 | 0,00 | 538 | -2,54 | ||||
| 2025-11-14 | 13F | Virtu Financial LLC | 0 | -100,00 | 0 | |||||
| 2026-02-13 | 13F | Cornerstone Financial Management LLC | 56 | 1 | ||||||
| 2026-02-17 | 13F | Dark Forest Capital Management Lp | 0 | -100,00 | 0 | |||||
| 2026-02-17 | 13F | Man Group plc | 255.267 | -18,95 | 2.785 | -21,07 | ||||
| 2026-04-07 | 13F | Farther Finance Advisors, LLC | 2.052 | 466,85 | 23 | 666,67 | ||||
| 2026-04-20 | 13F | Assenagon Asset Management S.A. | 18.270 | -39,24 | 208 | -36,89 | ||||
| 2026-02-17 | 13F | Serenity Capital Management Pte. Ltd. | 4.730.377 | 0,00 | 51.608 | -2,59 | ||||
| 2026-04-13 | 13F | E Fund Management Co., Ltd. | 2.140.520 | 10,98 | 24.338 | 23,46 | ||||
| 2026-02-05 | 13F | Northwestern Mutual Wealth Management Co | 57.265 | 1.145.200,00 | 1.891 | |||||
| 2026-02-03 | 13F | SBI Securities Co., Ltd. | 2.001 | -40,85 | 22 | -43,24 | ||||
| 2026-02-13 | 13F | Panagora Asset Management Inc | 11.142 | 0,00 | 122 | -2,42 | ||||
| 2026-02-17 | 13F | Alliancebernstein L.p. | 39.136 | 0,16 | 427 | -2,52 | ||||
| 2026-01-29 | 13F | IMC-Chicago, LLC | 63.035 | 59,83 | 688 | 55,78 | ||||
| 2026-01-29 | 13F | IMC-Chicago, LLC | Put | 109.900 | 5,98 | 1.199 | 3,27 | |||
| 2026-02-13 | 13F | Mariner, LLC | 15.964 | 11,32 | 175 | 8,75 | ||||
| 2026-01-29 | 13F | IMC-Chicago, LLC | Call | 250.500 | 46,58 | 2.733 | 42,74 | |||
| 2026-02-12 | 13F | Nuveen, LLC | 752.115 | -3,35 | 8.206 | -5,86 | ||||
| 2026-02-17 | 13F | Two Sigma Investments, Lp | 381.100 | 331,60 | 4.158 | 320,75 | ||||
| 2026-02-06 | 13F | EverSource Wealth Advisors, LLC | 960 | 23,87 | 10 | 25,00 | ||||
| 2026-02-17 | 13F | Veritas Asset Management LLP | 0 | -100,00 | 0 | |||||
| 2026-02-13 | 13F | Rhumbline Advisers | 52.760 | 3,54 | 576 | 0,88 | ||||
| 2025-11-14 | 13F | Fullerton Fund Management Co Ltd | 0 | -100,00 | 0 | -100,00 | ||||
| 2026-01-30 | 13F | Mitsubishi UFJ Trust & Banking Corp | 73.112 | -7,97 | 798 | -10,35 | ||||
| 2026-02-19 | 13F | CI Private Wealth, LLC | 51.084 | 1,42 | 554 | -1,95 | ||||
| 2026-02-13 | 13F | BNP Paribas Asset Management Holding S.A. | 130.861 | -0,73 | 1 | 0,00 | ||||
| 2026-03-06 | 13F | Hsbc Holdings Plc | 2.435.836 | 39,98 | 26.575 | 36,35 | ||||
| 2026-02-17 | 13F | Cetera Investment Advisers | 80.984 | -3,04 | 884 | -5,56 | ||||
| 2026-01-27 | 13F | Zurcher Kantonalbank (Zurich Cantonalbank) | 236.337 | 163,04 | 2.578 | 156,26 | ||||
| 2026-04-17 | 13F | Bell Investment Advisors, Inc | 305 | 43,19 | 3 | 50,00 | ||||
| 2025-11-07 | 13F | Alberta Investment Management Corp | 0 | -100,00 | 0 | |||||
| 2026-02-09 | 13F | Putnam Fl Investment Management Co | 40.783 | 70,43 | 445 | 65,67 | ||||
| 2026-02-17 | 13F | Advisor Group Holdings, Inc. | 13.024 | 1.118,33 | 142 | 1.190,91 | ||||
| 2026-02-05 | 13F | Allworth Financial LP | 1.000 | 0,00 | 11 | -9,09 | ||||
| 2026-01-21 | 13F | Greenleaf Trust | 32.625 | 5,15 | 356 | 2,31 | ||||
| 2026-02-17 | 13F | Schonfeld Strategic Advisors LLC | 0 | -100,00 | 0 | |||||
| 2026-01-26 | 13F | KBC Group NV | 176.571 | 22,94 | 2 | 0,00 | ||||
| 2026-02-19 | 13F | Invesco Ltd. | 435.546 | 9,89 | 4.752 | 7,03 | ||||
| 2026-02-13 | 13F | Ubs Asset Management Americas Inc | 19.553.569 | 213.329 | ||||||
| 2026-02-17 | 13F | D. E. Shaw & Co., Inc. | 69.050 | -79,57 | 753 | -80,10 | ||||
| 2026-02-17 | 13F | Public Employees Retirement System Of Ohio | 197.847 | 22,16 | 2.159 | 19,03 | ||||
| 2026-02-17 | 13F | Yiheng Capital Management, L.P. | 309.240 | 0,00 | 3.374 | -2,60 | ||||
| 2026-02-09 | 13F | Legal & General Group Plc | 2.239.835 | -12,00 | 24.437 | -14,28 | ||||
| 2026-02-17 | 13F | MIRAE ASSET GLOBAL ETFS HOLDINGS Ltd. | 258.888 | -7,41 | 2.824 | -9,81 | ||||
| 2026-04-24 | 13F | Sumitomo Mitsui DS Asset Management Company, Ltd | 24.250 | -32,93 | 276 | -30,20 | ||||
| 2026-02-12 | 13F | New York State Common Retirement Fund | 156.000 | 1.702 | ||||||
| 2026-02-17 | 13F | Bayesian Capital Management, LP | 0 | -100,00 | 0 | |||||
| 2026-01-29 | 13F | Rakuten Securities, Inc. | 0 | -100,00 | 0 | |||||
| 2026-02-13 | 13F | Wells Fargo & Company/mn | 5.160 | 3,37 | 56 | 1,82 | ||||
| 2026-02-13 | 13F | National Bank Of Canada /fi/ | 1.669.800 | -53,09 | 18.218 | -54,31 | ||||
| 2026-02-11 | 13F | Harvest Fund Management Co., Ltd | 1.037.058 | -7,75 | 11 | -8,33 | ||||
| 2026-02-10 | 13F | Intech Investment Management Llc | 0 | -100,00 | 0 |